HowReal-TimeWorkflowAdaptationReducesLatency

Delays in workflows can lead to lost revenue and poor user experiences. Real-time workflow adaptation solves this by processing tasks dynamically and instantly using live data. Unlike fixed sequences, this approach uses methods like parallel processing, caching, and event-driven architectures to cut delays from seconds to milliseconds.
Key points:
- Latency matters: Even 100ms delays can impact user experience and revenue.
- How it works: Real-time systems replace rigid steps with dynamic, continuous data streaming.
- Techniques used: Event-driven systems, in-memory processing, and Change Data Capture (CDC).
- Results: Faster responses, improved efficiency, and reduced costs.
Core Mechanisms for Reducing Latency
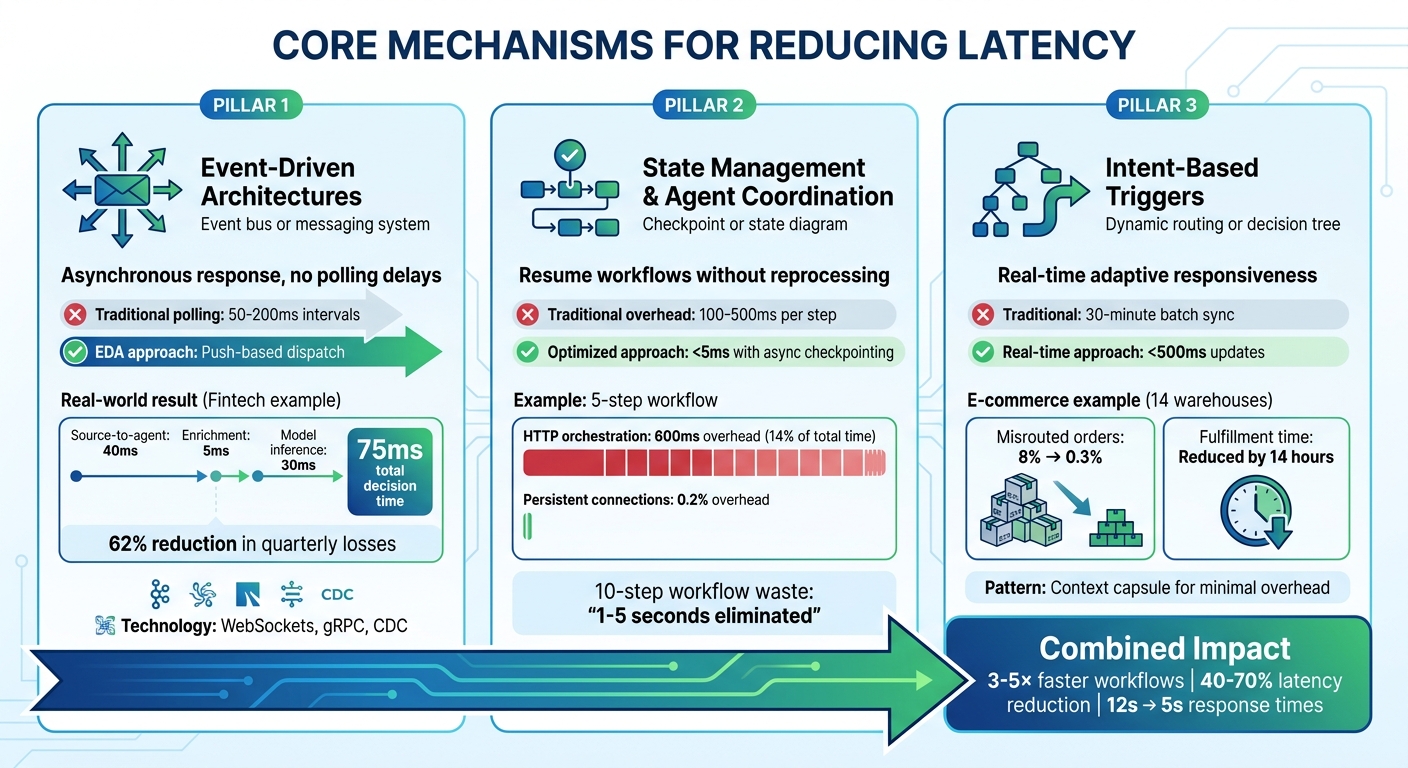
Three Core Mechanisms for Reducing Workflow Latency
Reducing latency relies on three key approaches: event-driven architectures, state management with agent coordination, and intent-based triggers. Each tackles specific challenges that traditional workflows often face.
Event-Driven Architectures
Event-driven architectures (EDA) operate by decoupling producers and consumers using an event bus. This setup allows agents to respond to changes asynchronously, skipping the delays of synchronous request-response models. Instead of relying on polling intervals - often between 50 and 200 milliseconds - EDA uses push-based dispatch to cut idle waiting times. Parallel processing also enables multiple consumers to act on a single event at the same time, which significantly reduces workflow delays.
Take the example of a fintech company managing 12,000 transactions per minute. By using Change Data Capture (CDC) to stream database changes in real-time, the system achieved impressive speed: source-to-agent latency of 40 milliseconds, enrichment lookups in just 5 milliseconds, and model inference in 30 milliseconds. This total decision time of 75 milliseconds enabled the company to block fraudulent transactions before settlement, reducing quarterly losses by 62%.
"The same decoupling that helped enterprises scale from monoliths to microservices applies to agent systems that operate across many tools and teams." – Airbyte
Persistent connections, like WebSockets or gRPC, further reduce delays by avoiding the overhead of TCP handshakes and TLS negotiations at every step. Additionally, using idempotency - assigning unique IDs to events - ensures that duplicate events don’t cause redundant processing if they are redelivered.
Once event handling is streamlined, managing state efficiently becomes the next crucial step in reducing latency.
State Management and Agent Coordination
With EDA enabling asynchronous operations, precise state management ensures agents can pick up where they left off without repeating work. By resuming workflows from checkpoints after failures, agents avoid reprocessing completed steps. Traditional systems often impose a latency penalty of 100–500 milliseconds per step, but asynchronous state persistence reduces this delay to under 5 milliseconds.
For instance, in a five-step sequential workflow, HTTP orchestration typically adds around 600 milliseconds of overhead - equivalent to 14% of the total execution time. By adopting persistent connections and asynchronous checkpointing, this overhead can shrink to just 0.2%. Decoupling state persistence from execution also allows steps to be orchestrated locally, while checkpoint messages are handled in the background.
"When each step transition adds 100–500ms of orchestration overhead, a 10-step agent workflow could easily accumulate 1–5 seconds of waste." – Inngest
It’s also critical to define step boundaries carefully. Placing boundaries around failure domains, such as external API calls, avoids unnecessary serialisation and persistence cycles. Additionally, offloading tasks like concurrency and rate-limiting checks from the main processing queue prevents delays from increasing as queues grow.
Intent-Based Triggers and Adaptive Logic
To complement asynchronous event handling and efficient state management, intent-based triggers provide adaptive responsiveness tailored to specific workflow requirements. These triggers rely on real-time signals to turn static processes into dynamic workflows. Each trigger should focus on a single responsibility, with safety checks - like user authorisation or data validation - ensuring smooth and accurate execution.
For example, an e-commerce company with 14 warehouses replaced a 30-minute batch sync with a streaming inventory agent. Using change capture, the agent updated inventory data in under 500 milliseconds. This upgrade reduced misrouted orders from 8% to 0.3% and cut average fulfilment time by 14 hours. By dynamically routing orders based on real-time inventory and location data, the company optimised its operations.
"The difference between a real-time agent and a near-real-time agent is not a minor latency improvement. It is an architectural divide that determines what problems your agents can solve." – Streamkap
To ensure smooth operations, decision traces can log every trigger activation, including the event, context, and decision made. This simplifies debugging and helps refine workflows over time. Using a "context capsule" pattern - where structured objects carry only the necessary information between agents - further reduces overhead. This ensures that each agent has exactly what it needs to perform its task without bloating the context window.
sbb-itb-1051aa0
Implementation Strategies
Applying real-time workflow changes effectively requires careful planning and technical decisions. The strategies outlined below aim to integrate seamlessly with current systems while achieving noticeable reductions in latency.
In-Memory Processing for Speed
In-memory processing speeds up operations by bypassing disk I/O and storing frequently accessed data in RAM. Tools like Hazelcast enable distributed RAM pooling, creating a unified, high-speed storage layer across multiple machines. To ensure consistency between in-memory caches and the main database, use Change Data Capture (CDC) updates. This approach isolates write latency and keeps caches accurate, even during server failures.
For example, Uber handles over 150 million cache operations per second by combining this method with staggered sharding. This involves using different hash functions for cache and database partitions, preventing a failure in one cache shard from overwhelming a single database shard. Instead, "miss" traffic is spread across the entire database cluster. During periods of high churn, marking cache keys with short Time-To-Live (TTL) values instead of deleting them can prevent cache stampedes.
Once in-memory updates are optimised, the next step is stream partitioning for efficient data distribution.
Stream Partitioning and Load Balancing
Partitioning plays a crucial role in parallel data processing, particularly in systems like Kafka and Redis. Increasing the number of partitions allows more consumers to process data simultaneously while maintaining strict ordering within each partition. High-cardinality keys, such as order_id or user_id, distribute load evenly, whereas low-cardinality keys, like country_code, can create hot partitions.
Fine-tuning Kafka settings, including the number of partitions and consumer group configurations, can significantly reduce pipeline latency - sometimes by as much as 50%, cutting delays from 200 milliseconds to 100 milliseconds. Monitoring the ratio of max(partition_lag) / avg(partition_lag) can help identify hot partitions; values over 5 often signal issues that need addressing. If a specific key is causing bottlenecks, "salting" the key by appending a random suffix can spread that data across multiple partitions. To future-proof systems, start with 2–3 times the number of partitions needed for current consumers, allowing for scalability without repartitioning existing data.
Change Data Capture (CDC) for Real-Time Data Ingestion
CDC streams changes directly from database transaction logs, eliminating the delays and load caused by traditional polling methods. Log-based CDC has minimal impact on database performance since it reads from existing transaction logs rather than querying tables. For seamless integration, enable logical replication settings like wal_level = logical in PostgreSQL or binlog_format = ROW in MySQL. To prevent disk overuse during CDC lags, set limits on Write-Ahead Log (WAL) sizes.
Using a dedicated CDC user with limited permissions (e.g., REPLICATION and SELECT) can isolate CDC traffic. For large tables, "incremental snapshots" allow data to be processed in chunks while streaming new changes, avoiding lengthy table locks. Setting errors.tolerance = none in connectors like Debezium ensures that malformed data triggers immediate errors rather than being silently skipped, which could lead to data loss. Consumers should use "upserts" (MERGE operations) based on primary keys and Log Sequence Numbers (LSN) to handle CDC’s "at-least-once" delivery model without creating duplicates. Additionally, monitor replication_slot_lag_bytes closely; exceeding thresholds like 10 GB could indicate a risk of the database disk filling up.
Monitoring and Continuous Optimisation
Keeping workflows running smoothly requires constant, real-time monitoring and alert systems. If you lack proper visibility, performance issues can sneak in and disrupt user experiences or business outcomes before you even realise it.
Real-Time Observability
To maintain high performance, track key metrics like execution spikes, success rates, and throughput. For production-grade systems aiming for 99.9% uptime or higher, having a clear view across all layers is essential. Use structured JSON logs for every execution, including details like execution ID, status, total duration (in milliseconds), and timestamps for each step. This makes it easier to spot delays and troubleshoot issues.
Tools like OpenTelemetry enable distributed tracing, which breaks down workflows into "spans" for each step - such as AI model calls or API requests. This helps visualise where time is being spent. For instance, Evaligo used distributed tracing to uncover that image generation consumed 50% of a total 7,565ms execution time, revealing a major area for improvement.
Instead of relying on average latency, focus on P95 latency to identify the slowest 5% of executions, which often have the most noticeable impact on user experience. Also, monitor retry rates and fallback usage to assess the reliability of external APIs and service providers. AgenticFlow demonstrated the value of this approach by implementing a self-healing lead processing workflow. Handling over 200 leads daily, it maintained a 99.99% uptime over six months using retry logic, fallback systems (like switching from GPT-4 to Claude to rule-based scoring), and real-time Slack alerts.
"Self-healing architecture adds 20–30% more development time upfront, but saves hundreds of hours of debugging and manual intervention over the lifetime of the workflow." – Husnain Mehmood, Founder, AgenticFlow
This kind of detailed monitoring feeds directly into automated alert systems, making it easier to detect and resolve issues quickly.
Automated Alerts and Anomaly Detection
Once you have robust observability in place, automated alerts become your next line of defence. These alerts can be prioritised based on severity: for example, critical failures might go to PagerDuty, medium-level issues to Slack, and lower-priority anomalies to email. Set up systems to flag unusual patterns, such as sudden execution time spikes, increased failure rates, or costs doubling compared to the baseline.
To manage temporary latency spikes, use techniques like circuit breakers and exponential backoff (e.g., waiting 2 seconds, then 4 seconds, then 8 seconds). Ensure workflows are idempotent by using unique IDs and "upsert" operations. This prevents duplicate data if a workflow is retried due to timeouts.
Interestingly, a 2025 survey of over 2,000 n8n workflows revealed that 34.7% lacked proper error handling. To address this, centralise your logs with full context, including timestamps, input data, error messages, and stack traces. This simplifies debugging and speeds up issue resolution. Additionally, track schedule-to-start latency to catch bottlenecks before they escalate.
"The goal isn't perfect monitoring - it's sufficient visibility to detect, diagnose, and resolve issues quickly." – Danny Lev, Founder & CEO, Evaligo
Conclusion
Real-time workflow adjustments can transform how systems operate, delivering faster results and improving efficiency. By applying these strategies, workflows can become 3–5× quicker, significantly cutting costs while boosting reliability. Techniques like parallelisation, caching, and using appropriately sized models can reduce latency by 40–70%, slashing response times from 12 seconds to just 5.
But the benefits go beyond just performance numbers. Faster workflows mean quicker feedback, which enhances user experiences. Real-time insights also help teams maximise resource usage and spot bottlenecks before they turn into major issues. Organisations that adopt these methods gain an edge by acting on data as it’s created, rather than waiting for traditional batch processing cycles. This progress relies on careful design and ongoing refinement.
"The fastest, most reliable agentic workflows don't just happen. They are a result of ruthless step-cutting, smart parallelisation, deterministic code, model right-sizing, and caching everywhere it makes sense." – Rohit Jacob, Builder and AI Researcher
The best way to start? Begin small. Use the simplest model that meets your needs, set a performance baseline, and then optimise gradually. Measure key metrics like Time to First Token (TTFT) and Tokens Per Second (TPS) to guide improvements. Replace unpredictable large language model (LLM) calls with deterministic code when possible, parallelise tasks that don’t depend on each other, and introduce multi-level caching for both prompts and intermediate results.
For businesses looking to create scalable, adaptive workflows with real-time capabilities and AI integration, consider reaching out to Antler Digital. They specialise in building modern web applications that improve operational efficiency for industries like FinTech, SaaS, and custom web solutions.
FAQs
When should we use real-time workflows instead of batch jobs?
Real-time workflows shine in scenarios where low latency is a must. Think live dashboards, fraud detection systems, inventory updates, or instant notifications - these processes demand responses in seconds or even milliseconds. On the flip side, batch jobs are more appropriate for tasks like generating daily reports or handling bulk updates, where immediate results aren't necessary. Opt for real-time workflows to keep operations swift and responsive in critical, time-sensitive situations.
What’s the simplest way to add Change Data Capture (CDC) to an existing database?
The easiest approach to implement Change Data Capture (CDC) is by leveraging log-based methods that make use of a database's transaction logs. For PostgreSQL, you can start by enabling logical replication - this involves setting the wal_level parameter to logical. After that, you'll need to set up replication slots and publications.
Alternatively, tools like Debezium can simplify the process by directly reading transaction logs. Debezium captures row-level changes and streams them to systems like Kafka. This method requires minimal configuration and avoids the need for significant alterations to your existing setup.
Which latency metrics should we monitor first in production?
Monitoring workflow duration, success rate, and error rate is essential for identifying performance issues in production. These metrics help you spot problems early and ensure smooth operations. For systems like Temporal, keeping an eye on task schedule-to-start latency is equally important, as it highlights delays in task processing. By tracking these key metrics, you can uncover bottlenecks, fine-tune workflows, and minimise latency efficiently.

Lets grow your business together
At Antler Digital, we believe that collaboration and communication are the keys to a successful partnership. Our small, dedicated team is passionate about designing and building web applications that exceed our clients' expectations. We take pride in our ability to create modern, scalable solutions that help businesses of all sizes achieve their digital goals.
If you're looking for a partner who will work closely with you to develop a customized web application that meets your unique needs, look no further. From handling the project directly, to fitting in with an existing team, we're here to help.